AV Simulation  ·  Evaluation  ·  Safety Testing

av-sim-bench

An automated evaluation framework for autonomous driving simulators — safety compliance, behavioural regression detection, and statistical fidelity testing.

View on GitHub Explore projects

Why simulation evaluation matters

Simulation is the primary scaling lever for AV safety testing. Before a simulator can be trusted, you need a repeatable, automated way to grade its output against a known-good baseline. Without it, regressions — agents that roll stop signs, run red lights, or drift in cruise-speed distribution — go undetected until they reach the real world. This project provides that harness: ingest logs, run metrics, get a verdict.

Three evaluation systems

P1 — Log-Replay Evaluator

Behavioural metrics on Parquet logs

Ingests columnar driving logs, runs 5 pure metric functions, emits metrics.json + a 4-panel dashboard PNG — answering whether the simulator did the right thing.

5 metrics  ·  3 scenarios  ·  catches stop violations, red-light runners, and KS-detected speed drift
GoalVerify a simulator produces safe, compliant agent behaviour against a known-good baseline.
Scenariosgolden (all pass), regression (red-light + stop-sign violators), noisy (speed jitter, σ=1.2).
Designschema.py is the single source of truth for map geometry — metric logic never hardcodes y-bounds.
KS testCruise-only speeds (stop zones excluded) vs baseline. Distribution-free — works on non-Gaussian profiles.
Outputmetrics.json + 4-panel dashboard PNG (speed histogram, compliance bar, violations, KS p-value).
P2 — Grid-World Sim + Eval

Graph-based driving simulator

NetworkX A* graph simulator with config-driven scenarios via YAML. Adds a graph-aware route-plan adherence metric on top of the P1 suite.

6 metrics  ·  A* pathfinding  ·  route-plan adherence catches off-path deviations
GoalSimulate a city grid and evaluate whether agents follow planned routes, obey signals, and avoid collisions.
Sim engineNetworkX DiGraph with typed nodes (road / stop_sign / traffic_light). Agents follow A* plans tick-by-tick.
Traffic lights50-tick cycle (GREEN×20, YELLOW×5, RED×25). Phase offsets stagger intersections by position: (x*5 + y*3) % 50.
Scenarios3 YAML-driven configs: golden (full compliance), regression (violation flags set), noisy (speed jitter).
New metricRoute-plan adherence — verifies agent visited every node in the A* plan. Catches off-path shortcuts invisible to P1 metrics.
P3 — Gen vs. Deterministic A/B

Statistical fidelity testing

5 statistical tests (KS, Wasserstein, Anderson-Darling, Chi-square, Energy distance) with BH-FDR correction across 4 traffic dimensions.

Catches miscalibrated generator on every dimension — even when safety metrics pass
GoalAnswer: "Is this traffic generator statistically equivalent to ground truth?" — beyond safety rule checks.
Dimensionsspeed_mps (continuous), gap_s (continuous), lane_changes (count), turn_choice (categorical).
TestsKS, Wasserstein distance, Anderson-Darling, Chi-square, Energy distance. BH-FDR correction applied across all tests jointly.
GeneratorsDeterministic (fixed), well-tuned stochastic (near baseline), miscalibrated stochastic (divergent but safety-passing).
Key findingMiscalibrated generator passes 100% of safety metrics, fails 100% of statistical fidelity tests — safety metrics alone are insufficient.

Log-Replay Evaluator — How it works

Architecture

src/evaluator/
  schema.py  → Parquet schema + map geometry constants (single source of truth)
  log_gen.py → synthetic scenario generator (PyArrow + NumPy)
  metrics.py → 5 pure metric functions (Pandas / SciPy)
  cli.py     → Click CLI wiring everything together

┌─────────────┐         ┌──────────────┐  Parquet   ┌─────────────────┐  MetricResult[]  ┌─────────────┐
│  schema.py  │ ──────▶ │  log_gen.py  │ ─────────▶ │   metrics.py    │ ───────────────▶ │   cli.py    │
│ (schema +   │         │ (3 scenarios)│            │  (5 pure fns)   │                  │  JSON + PNG │
│  geometry)  │ ──────▶ └──────────────┘            └─────────────────┘                  └─────────────┘
└─────────────┘

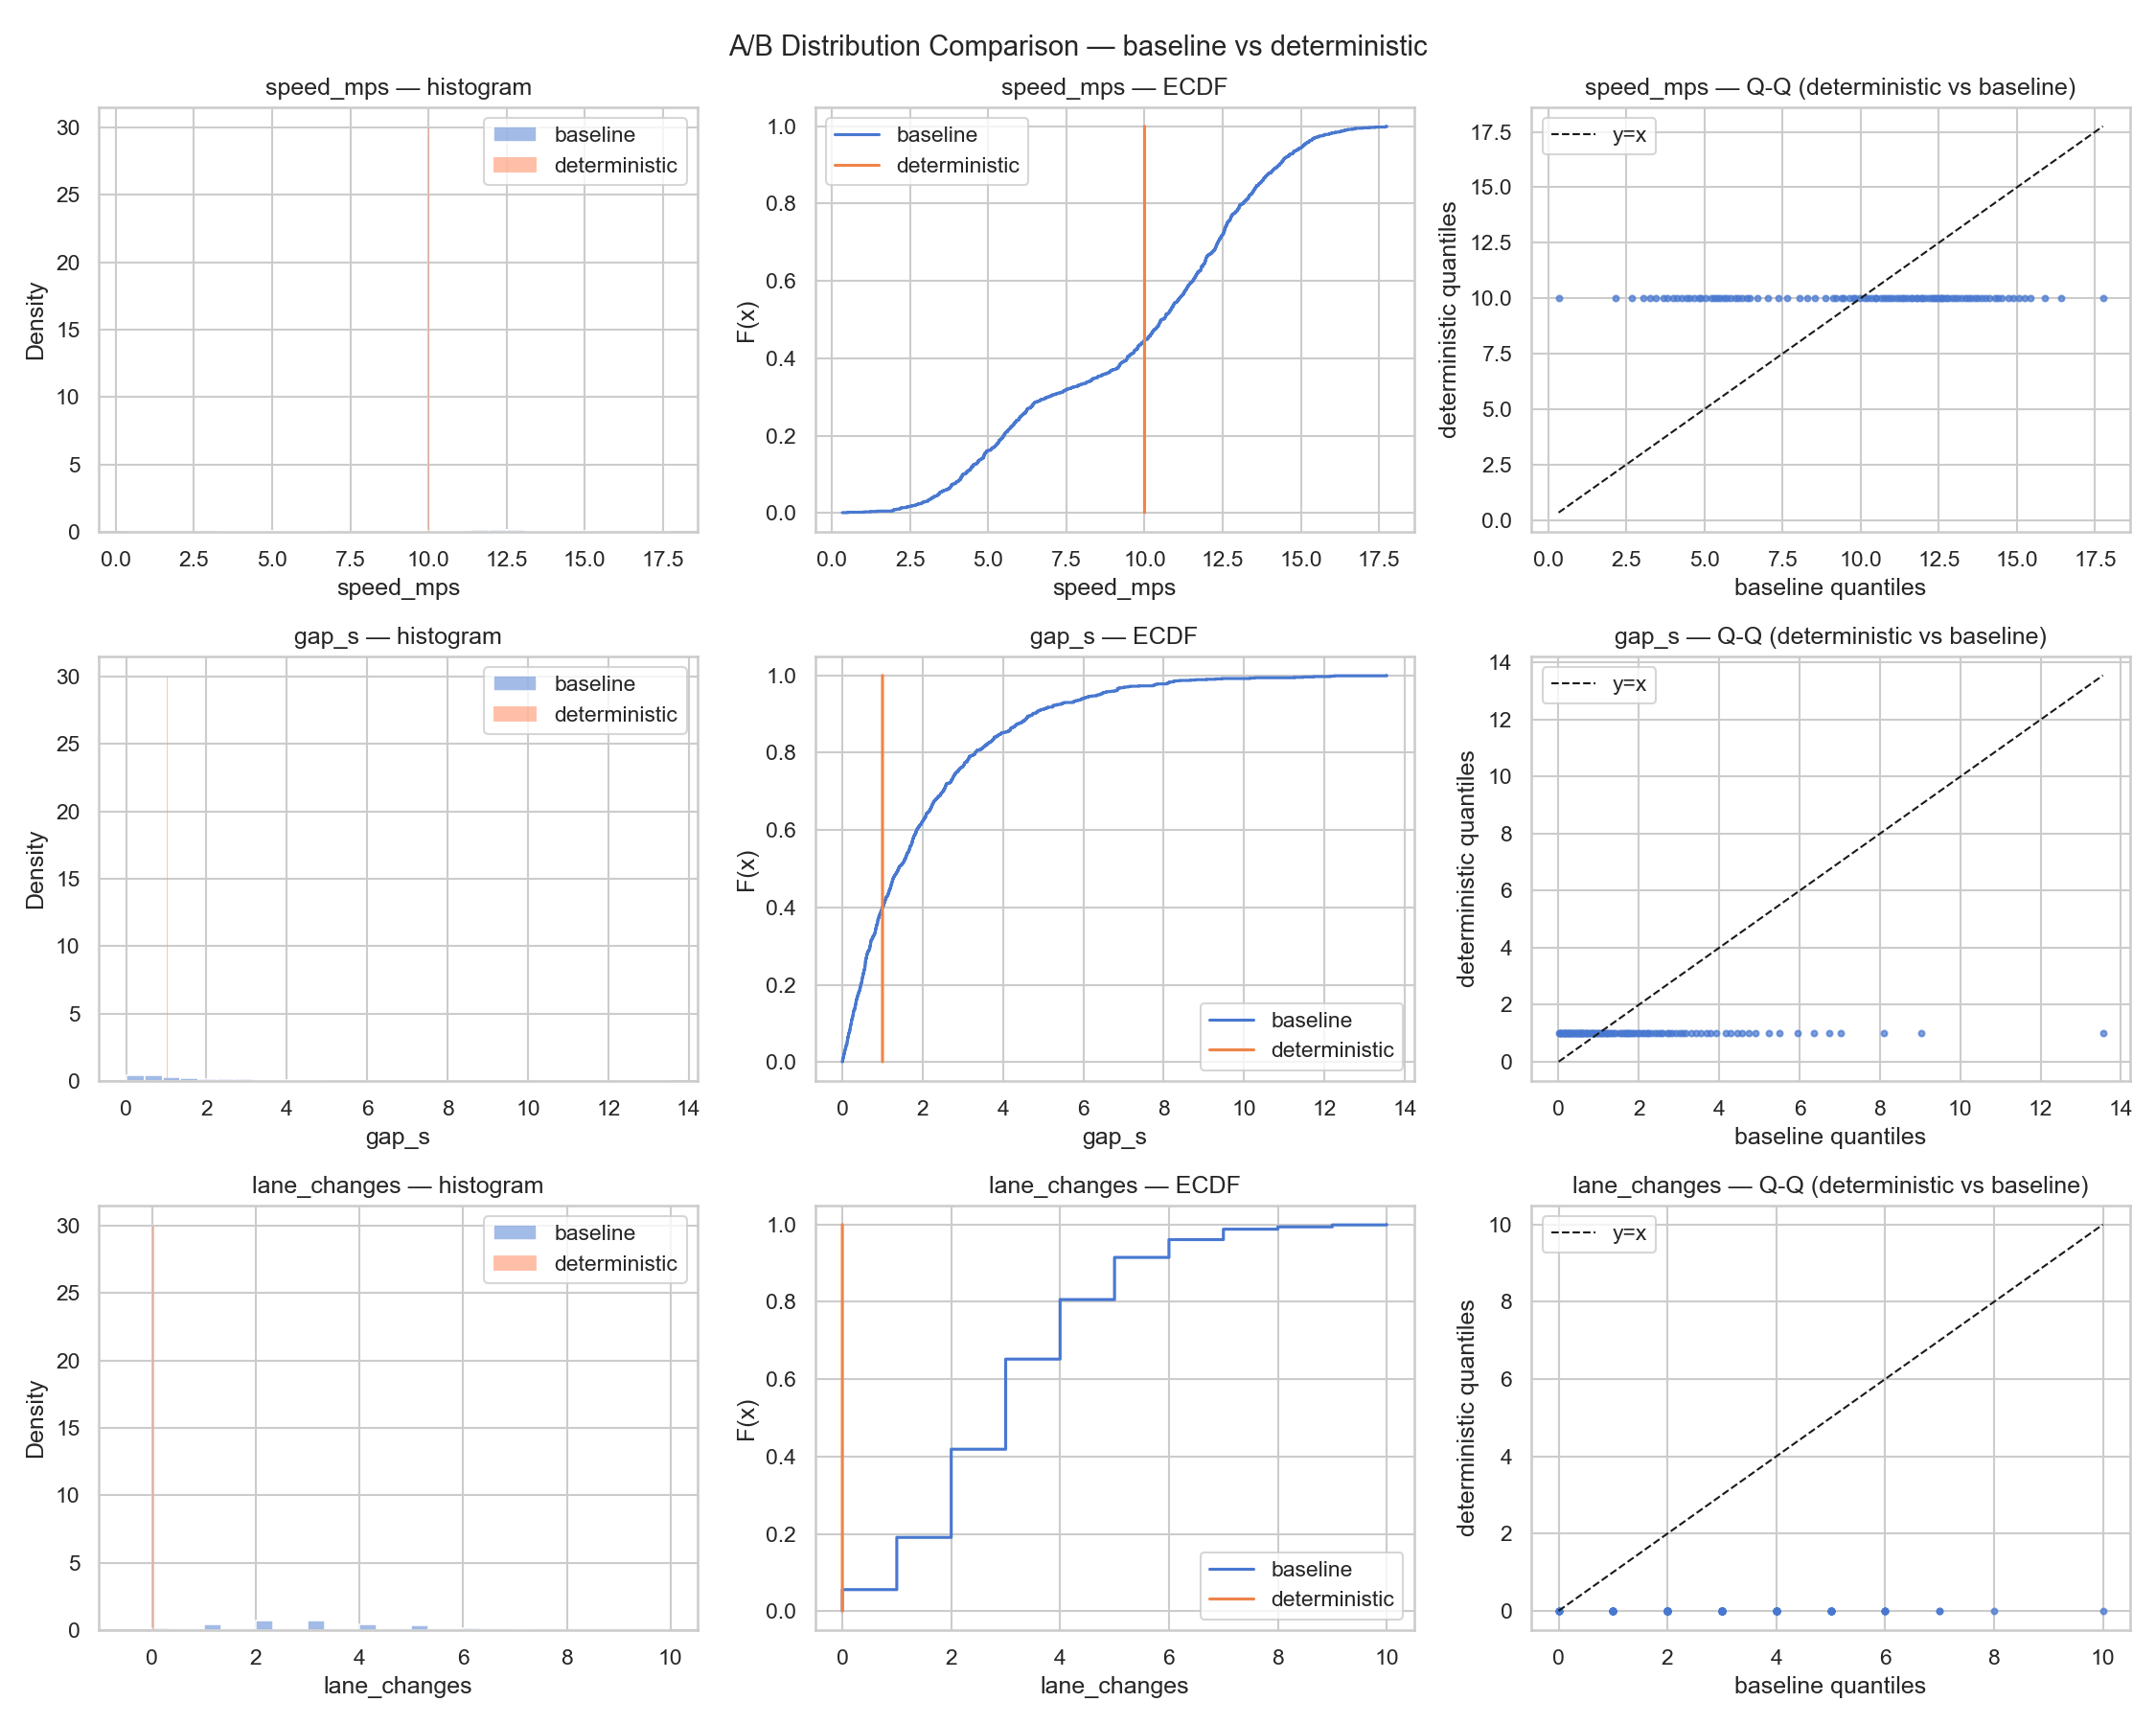
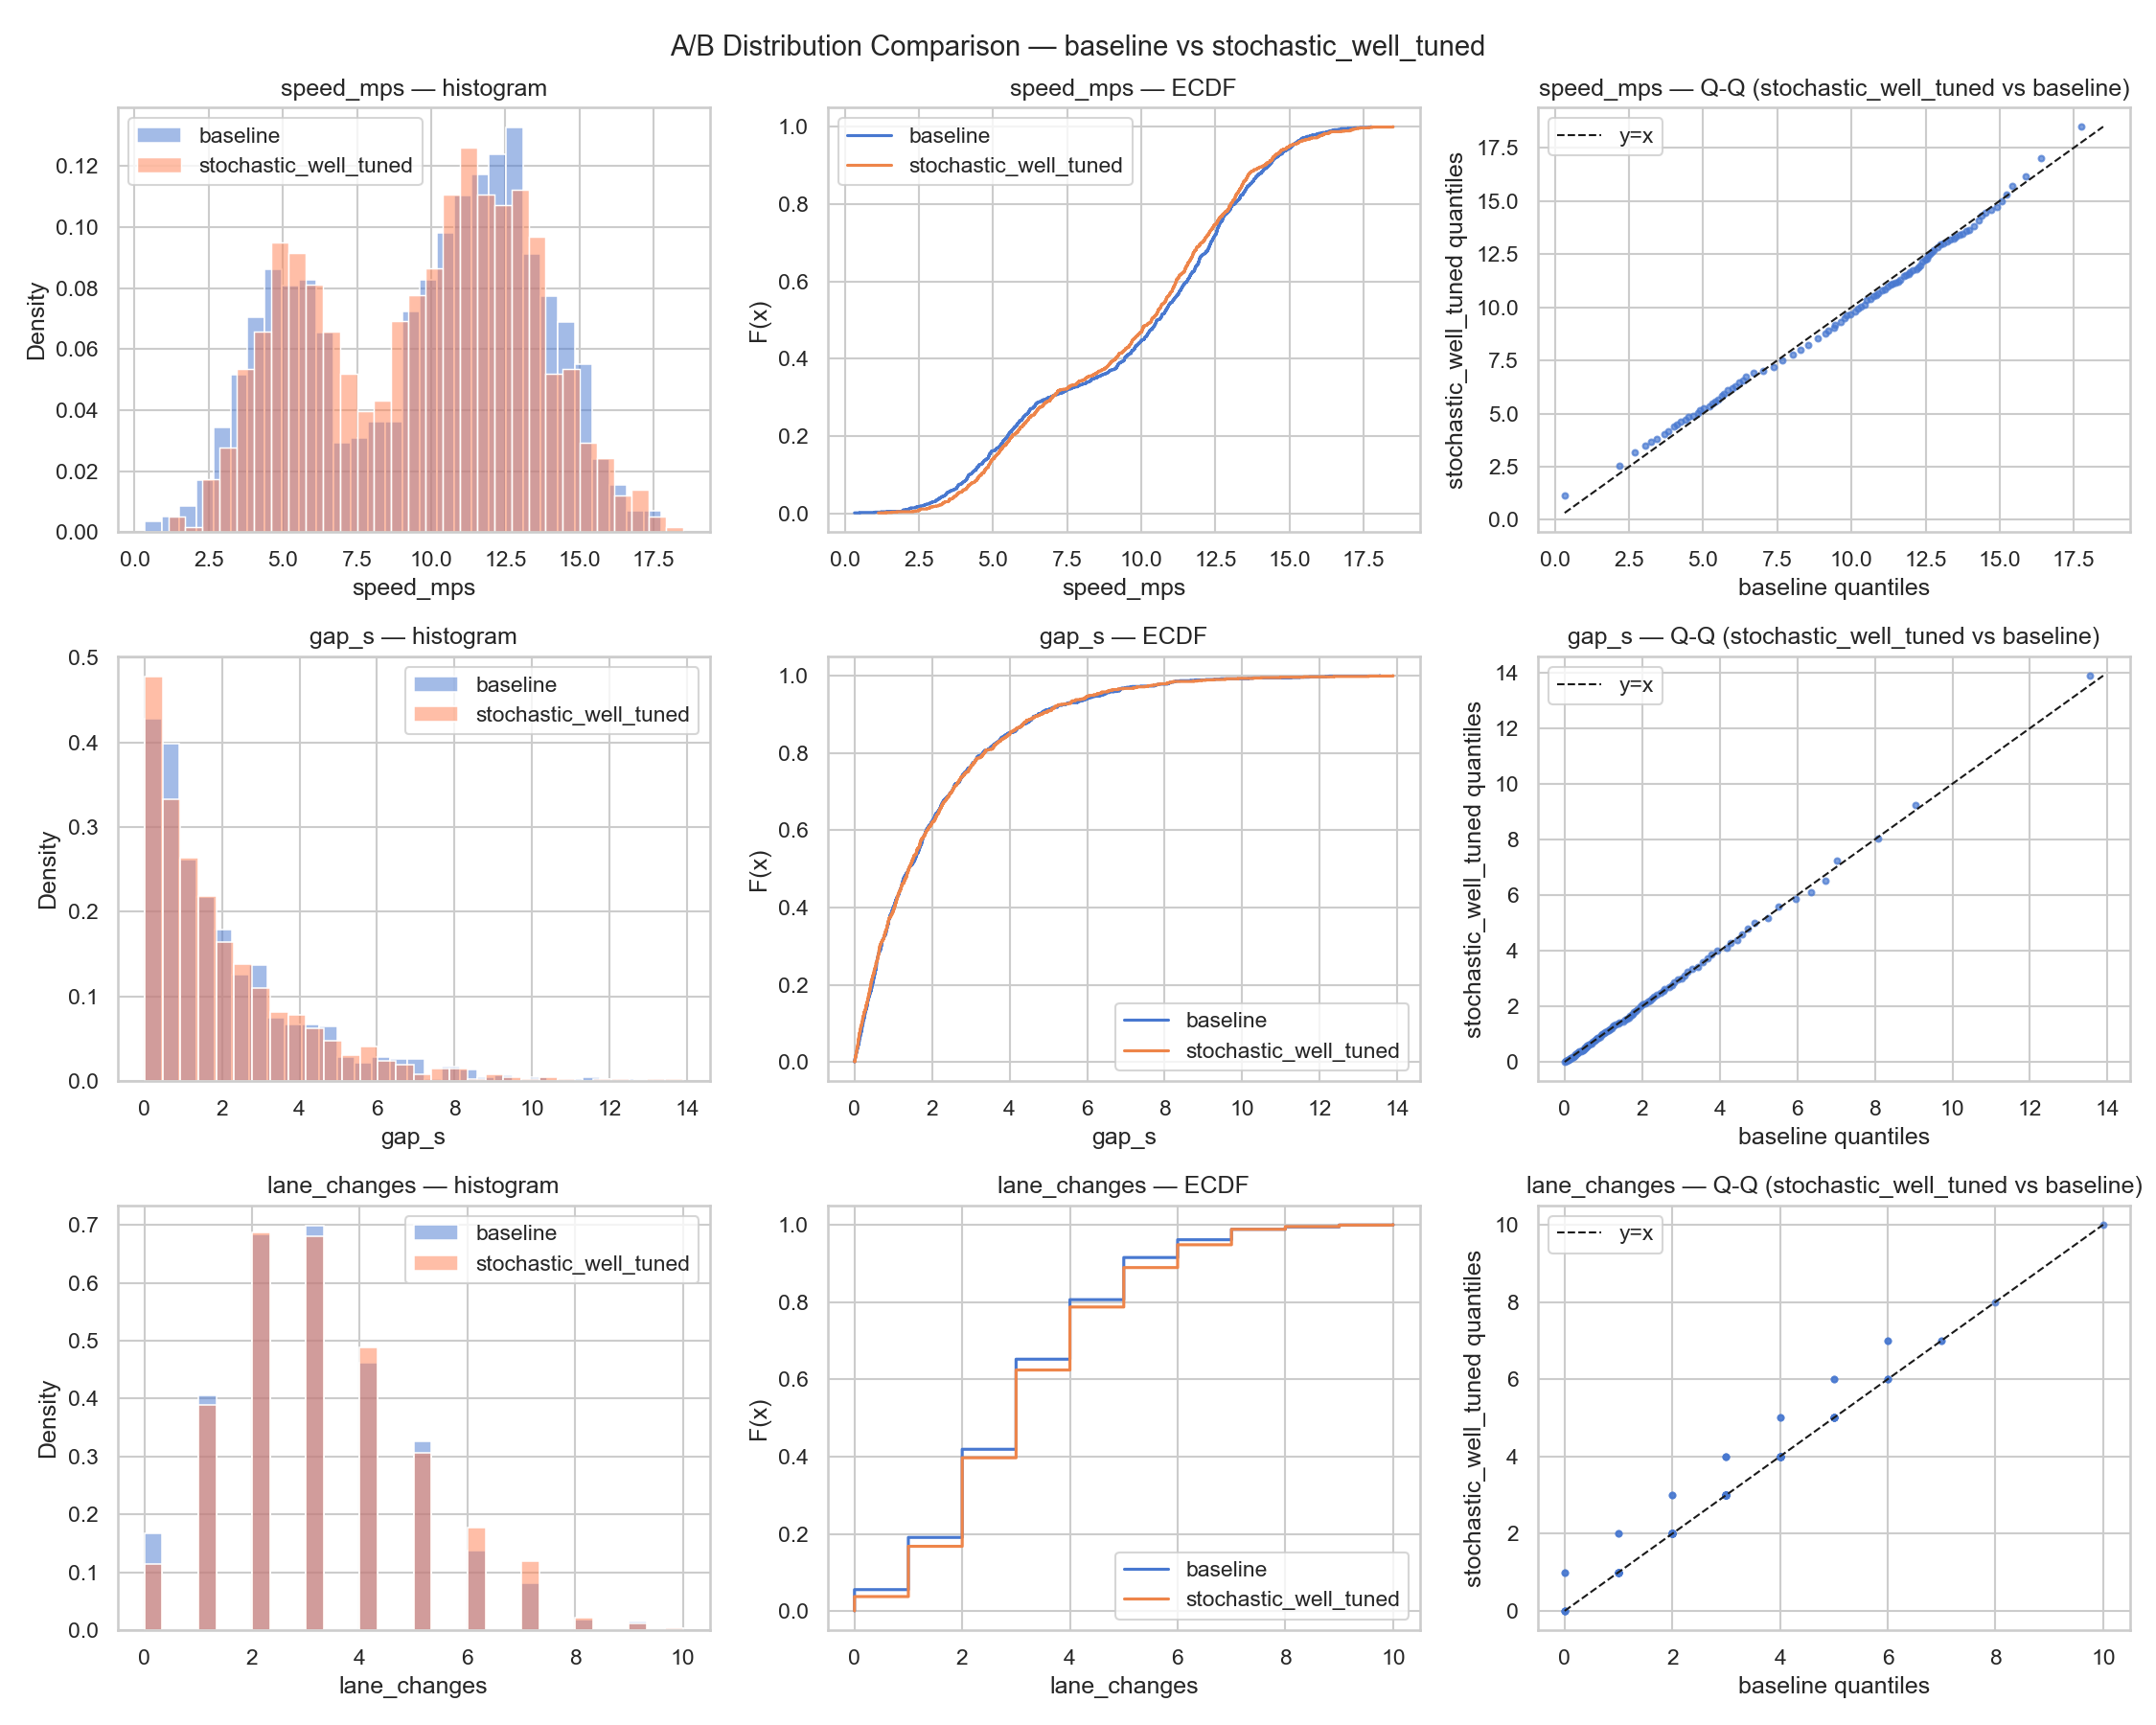
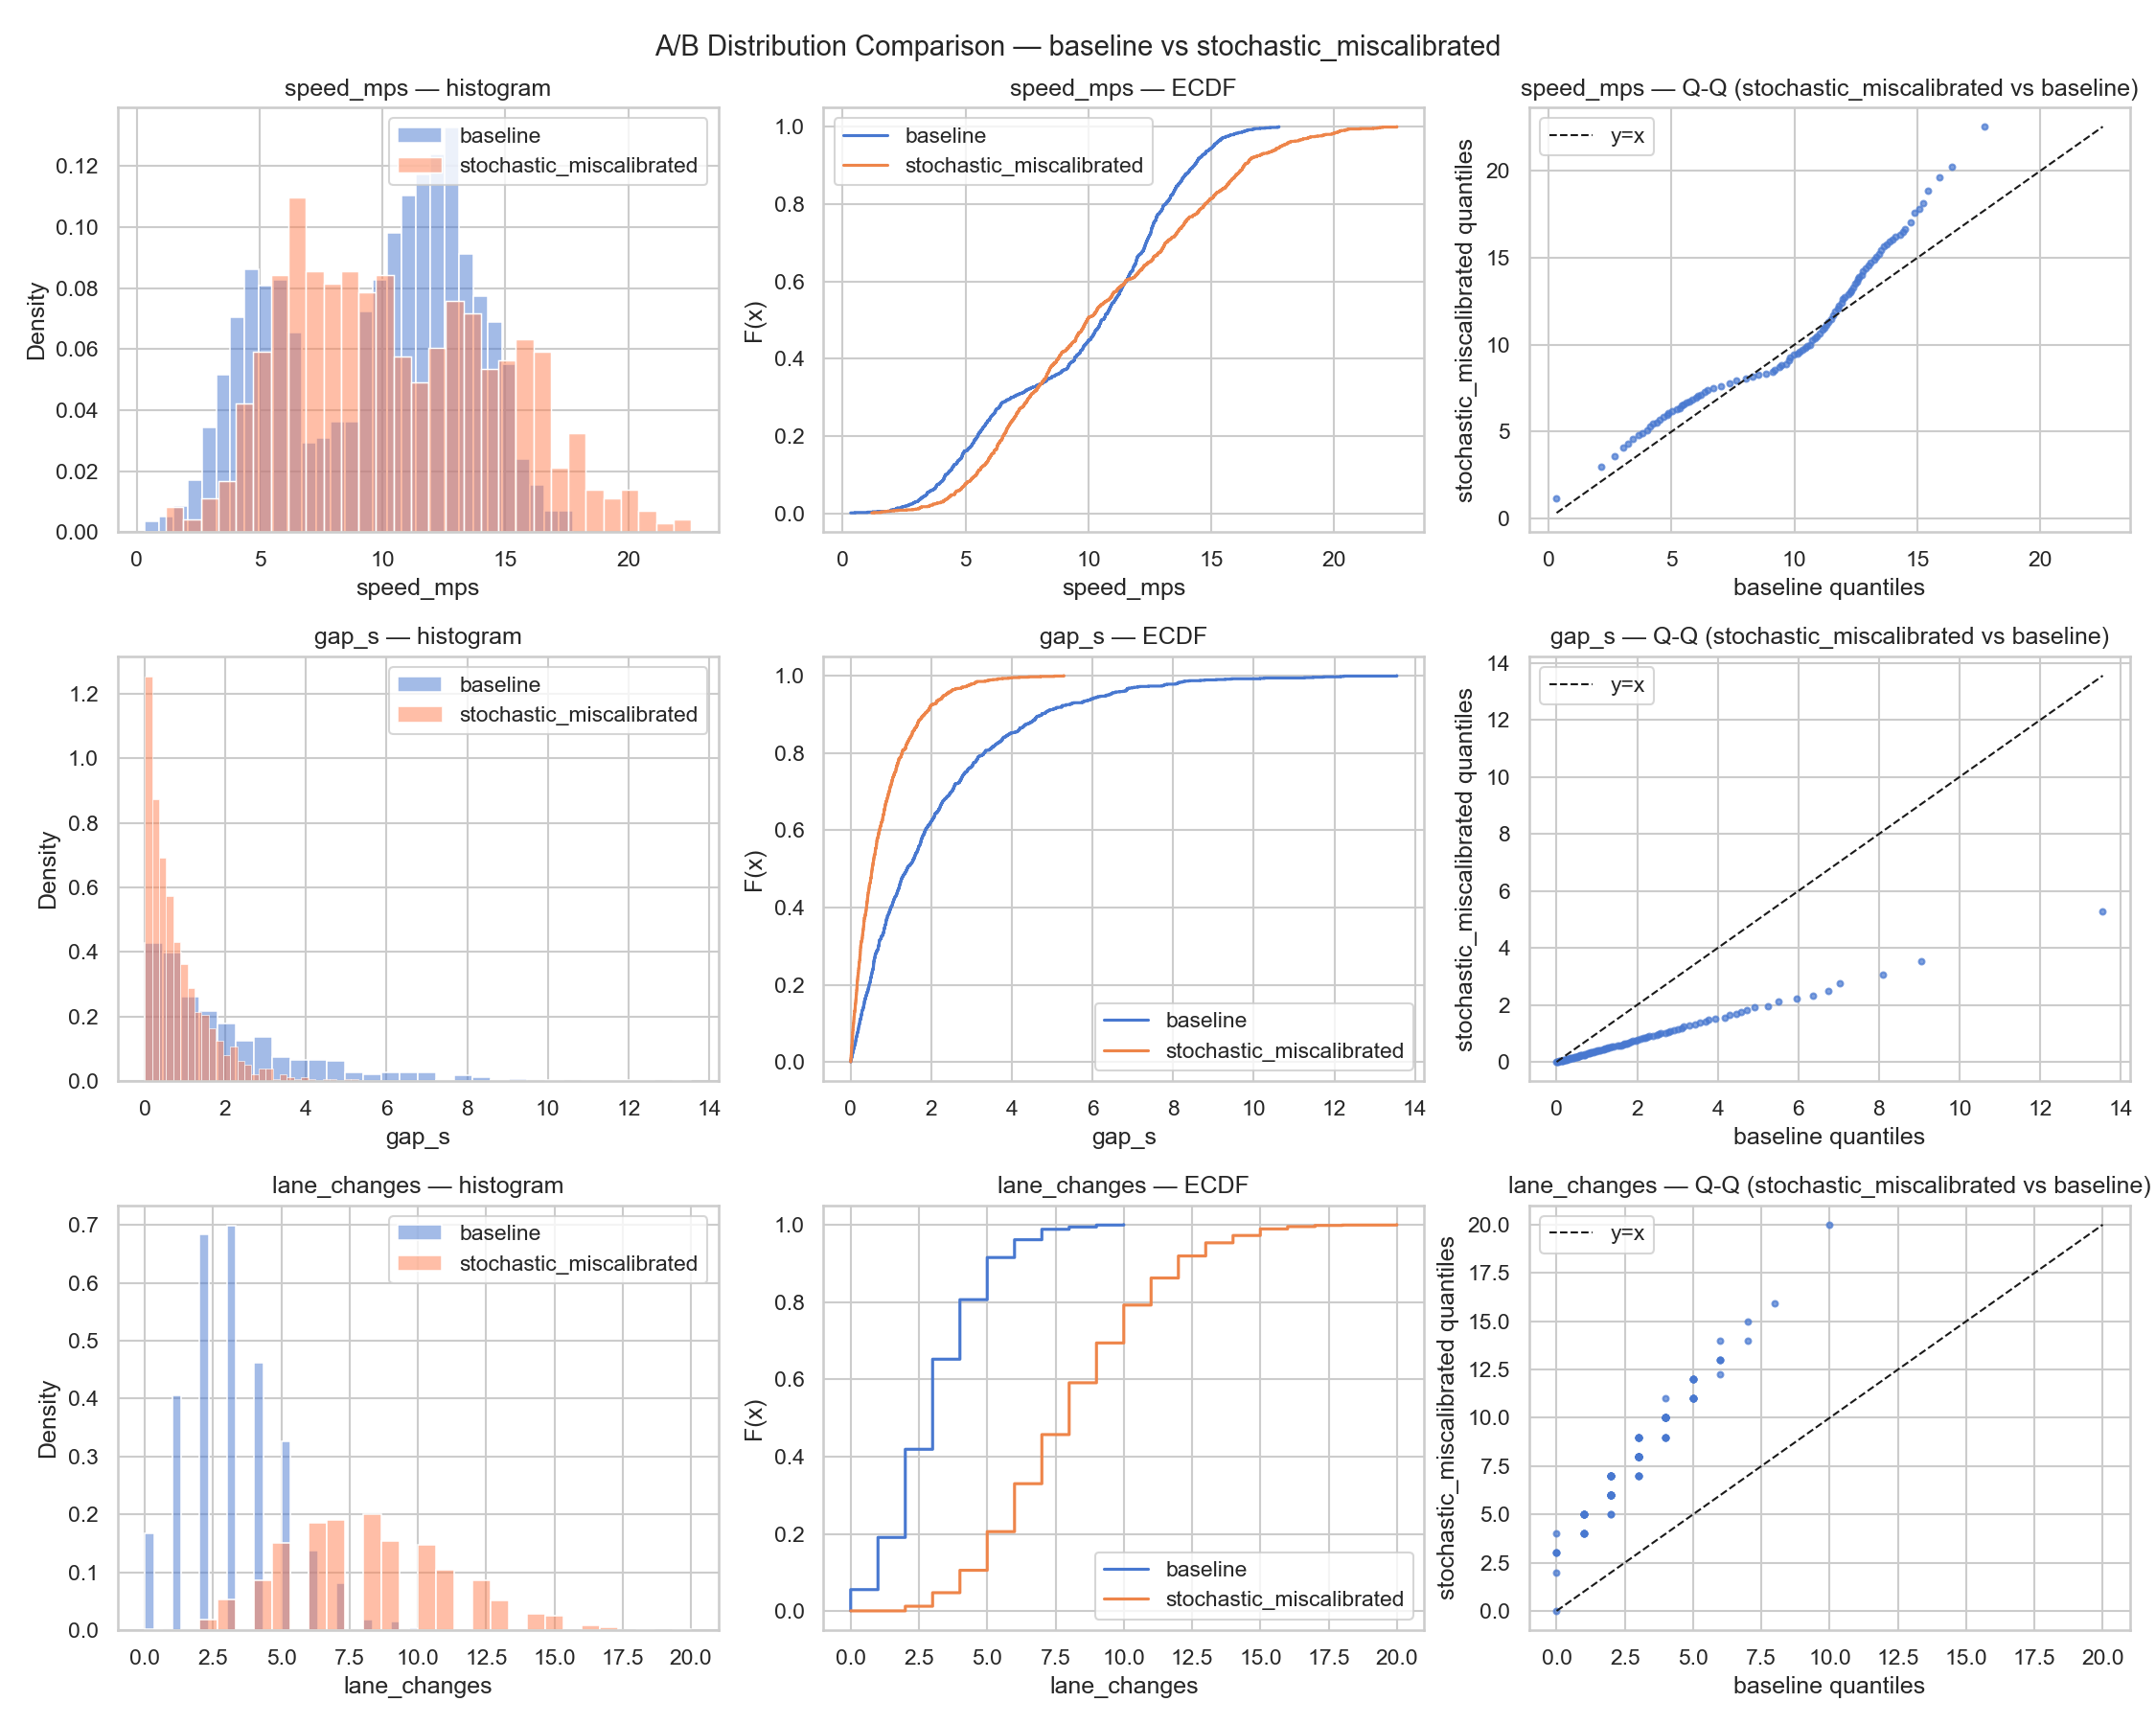
Metrics — 3-scenario comparison

Loading metrics…

P1 4-panel dashboard: speed histogram, stop compliance bar, violation summary, KS p-value

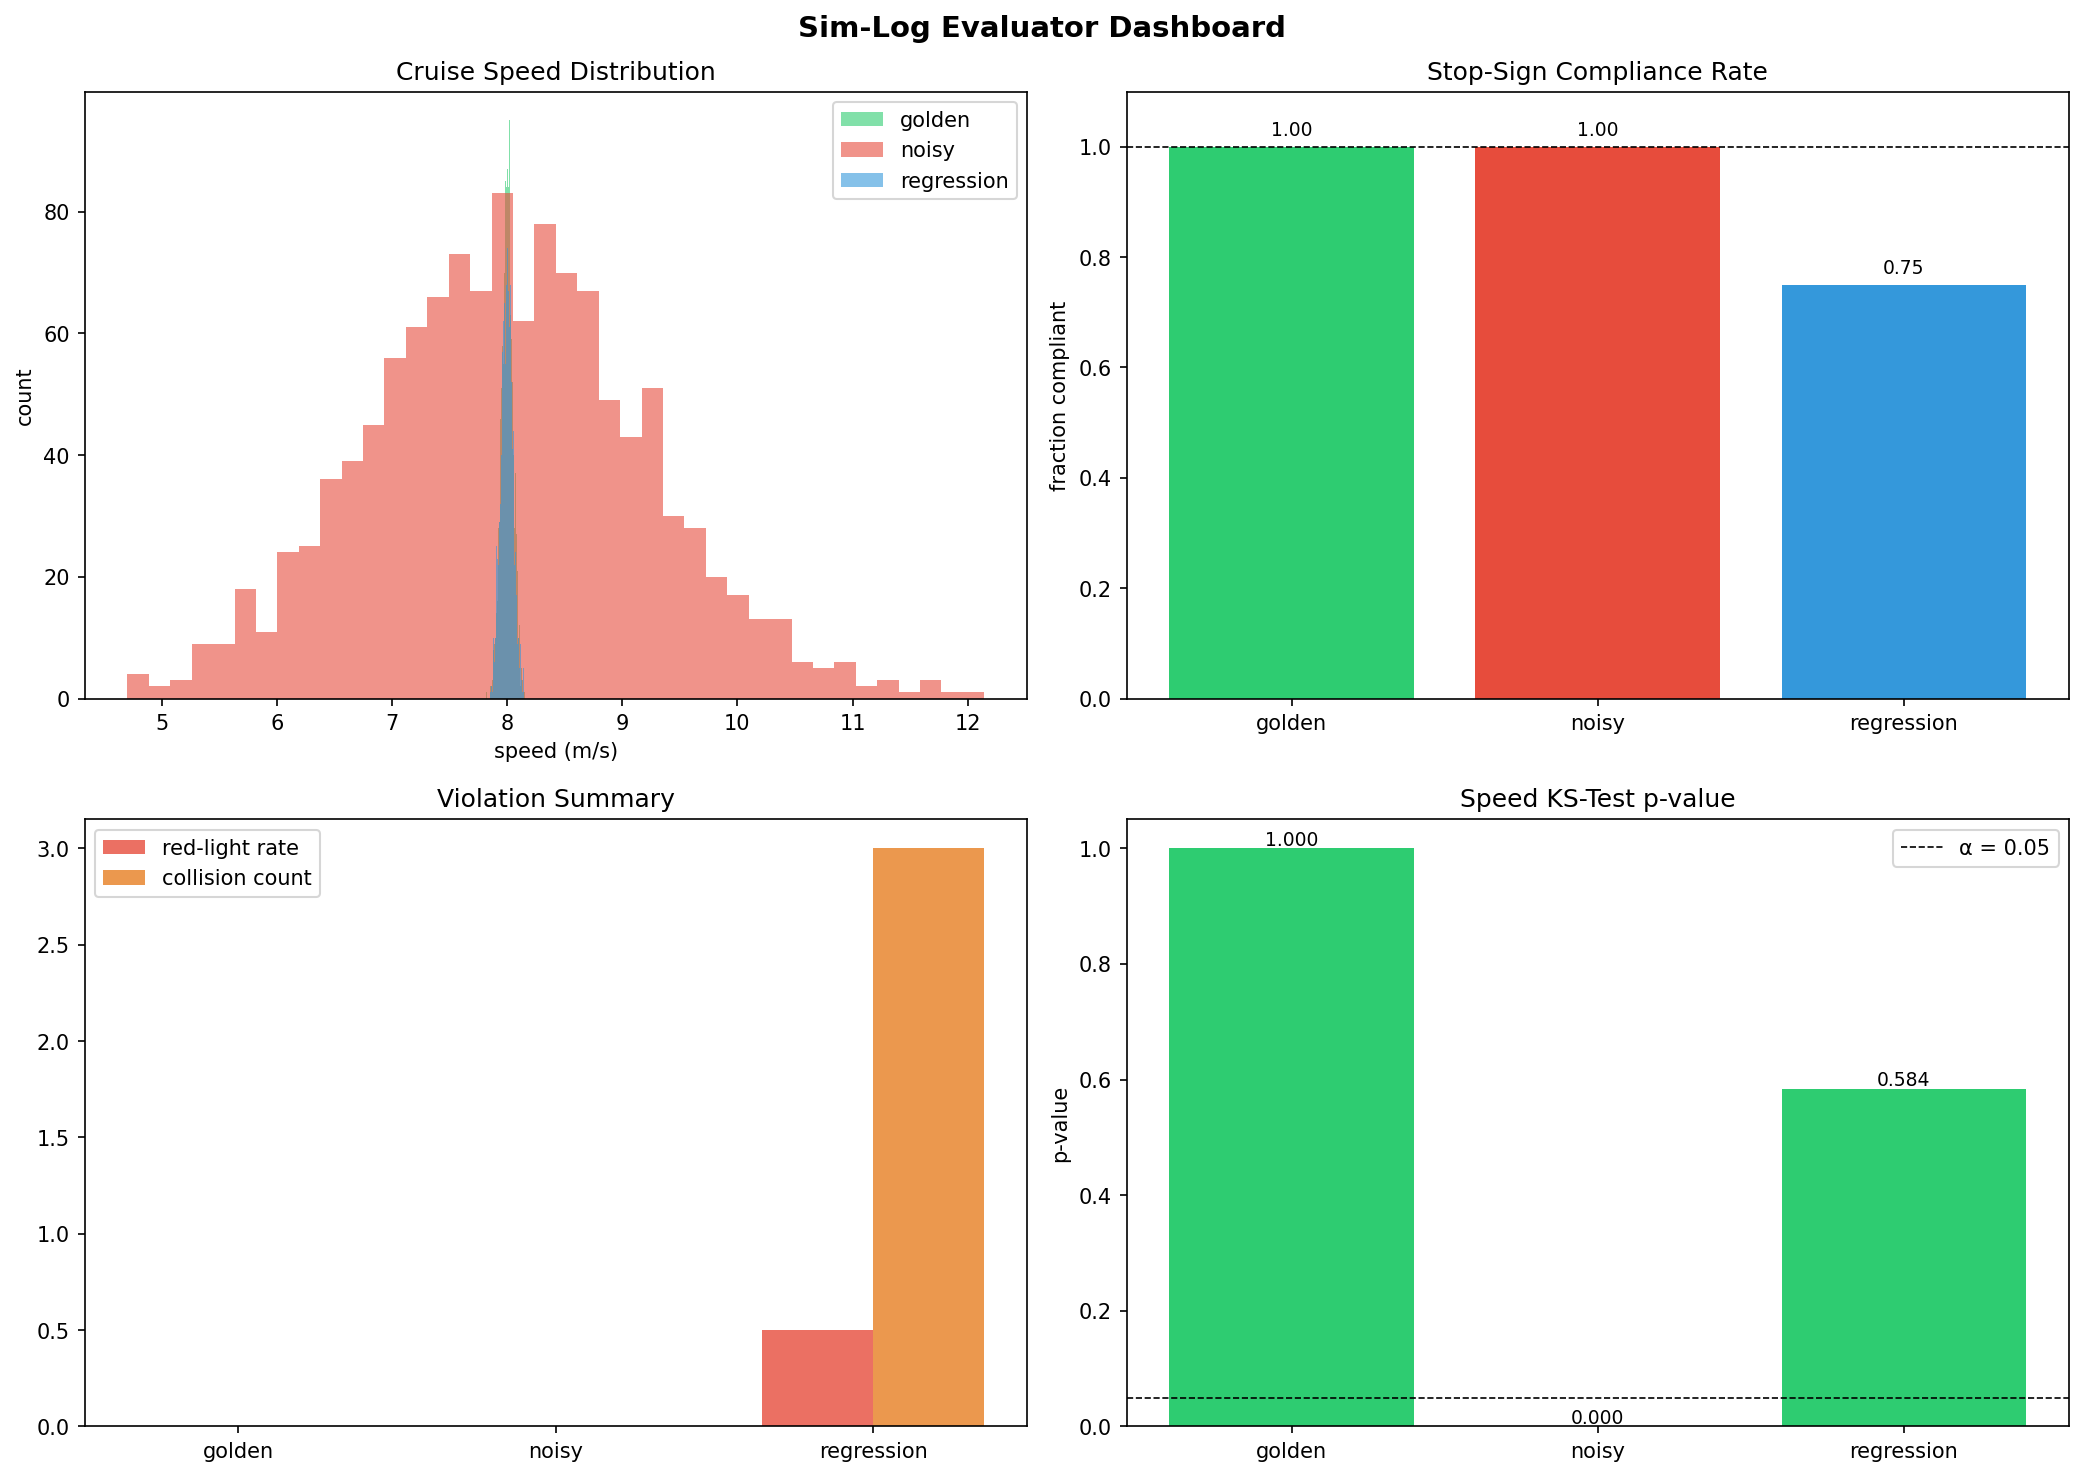
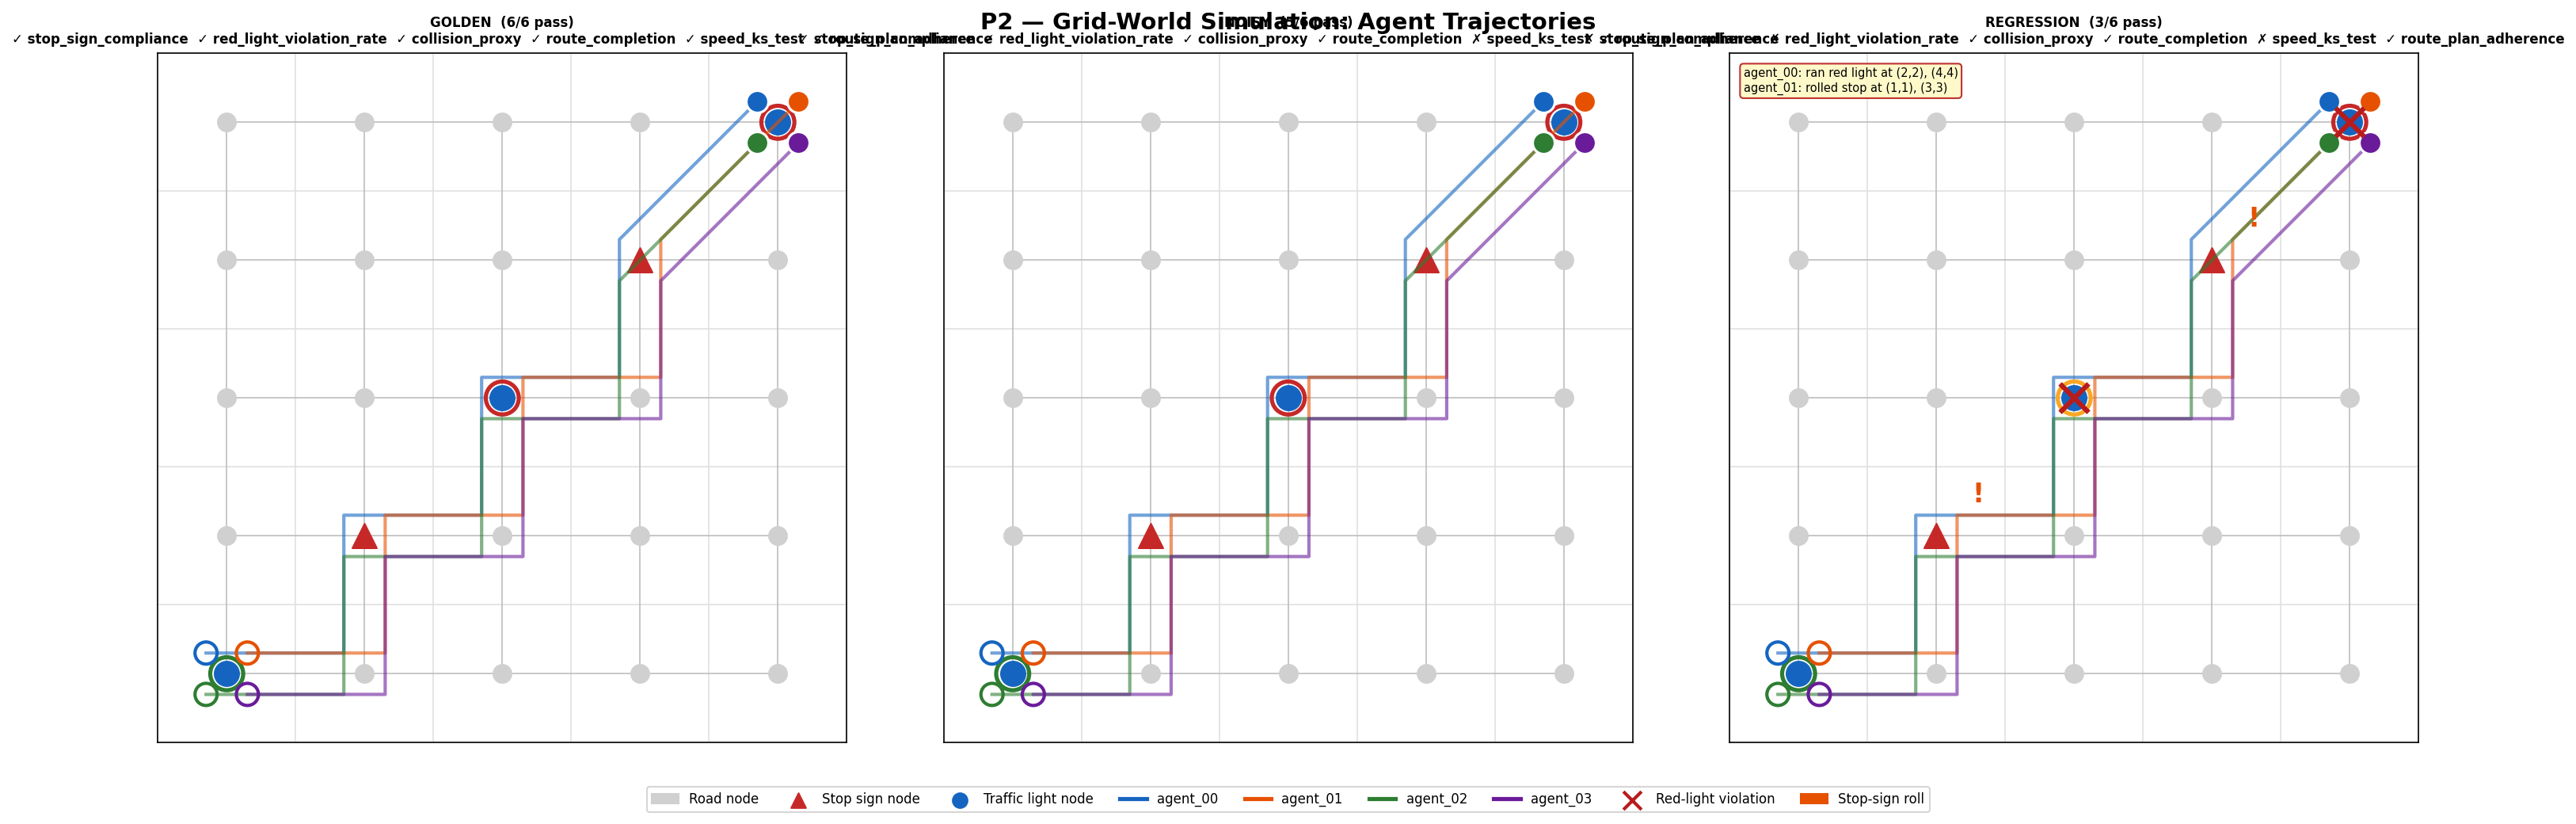
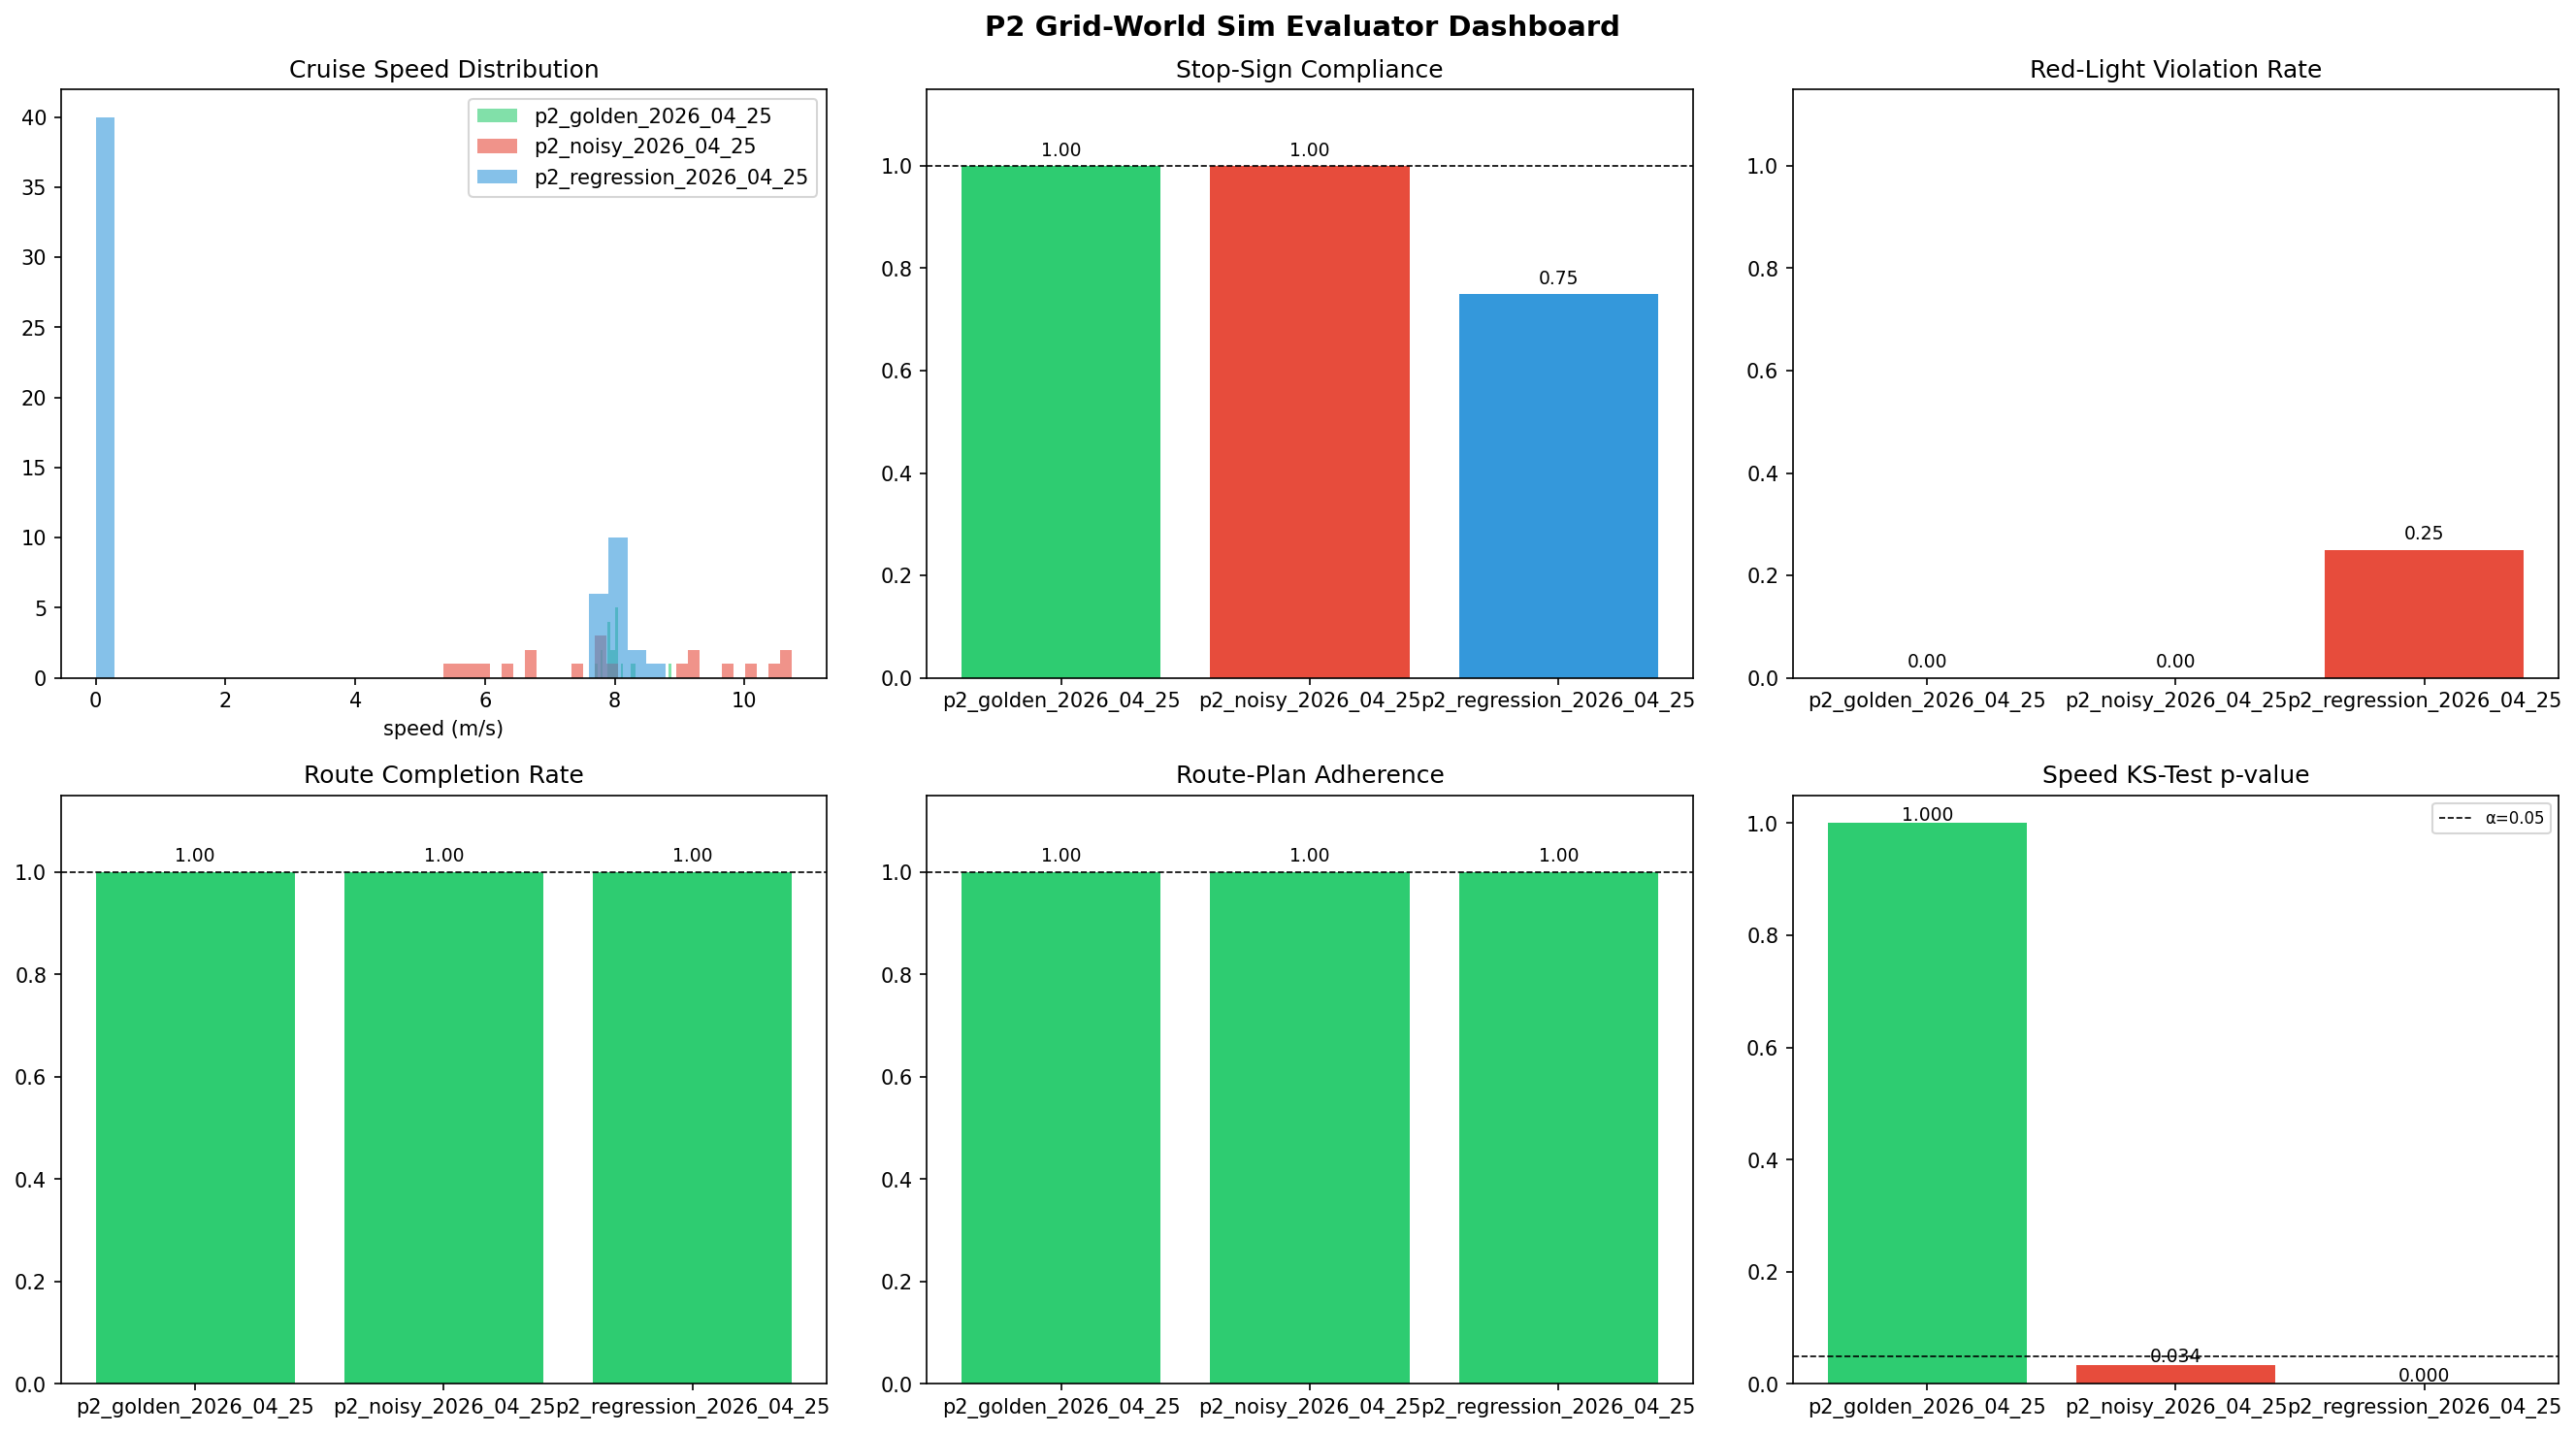
P1 dashboard: speed histogram, stop compliance bar, violation summary, and KS p-value across all 3 scenarios

Visualising agent behaviour

Top-down 1D track animation: 4 agents as dots moving toward the goal (y = 50 m). Stop zone (y = 18–22 m) and intersection (y = 22–28 m) are marked. Golden agents stop and wait; regression agents blow through.

P1 agent trajectory animation — golden vs regression

Grid-World Simulator — How it works

A config-driven city grid built on NetworkX with A* pathfinding. Agents navigate typed nodes — road, stop_sign, traffic_light — obeying a 50-tick light cycle with coordinate-based phase offsets to stagger intersections. Three YAML scenarios (golden, regression, noisy) exercise 6 metrics including a new graph-aware route-plan adherence check that P1 cannot detect.

P2 static grid-world — 3 panels: golden, noisy, regression

Scenario comparison — golden / noisy / regression: node layout, agent paths, and stop-sign positions across all 3 YAML configs

P2 animated grid-world — golden vs regression agent trajectories

Agent animation — golden agents follow the A* plan exactly; regression agents deviate off-route, triggering route-plan adherence failures

P2 grid-world simulator dashboard — 6-metric evaluation

P2 dashboard: 6-metric evaluation across 3 scenarios, including route-plan adherence

Gen vs. Deterministic A/B results

Each generator is evaluated against the ground-truth baseline across 4 traffic dimensions using 5 statistical tests with Benjamini-Hochberg FDR correction. Click any chart to expand.

Deterministic generator — statistical test results
Equivalent

Deterministic generator

Reproduces ground-truth distributions exactly. All 5 statistical tests pass across all 4 traffic dimensions.

Fixed-pattern generator with no randomness — produces identical outputs on every run.

KS test✓ Pass
Wasserstein distance✓ Pass
Anderson-Darling✓ Pass
Chi-square✓ Pass
Energy distance✓ Pass

BH-FDR correction: no rejections. All 4 traffic dimensions within baseline tolerance.

Well-tuned stochastic generator — statistical test results
Equivalent

Stochastic — well-tuned

Slight variation within acceptable bounds. Statistical tests confirm distributional equivalence to the baseline.

Gaussian-sampled traffic with parameters calibrated close to the baseline distribution. Natural variation but no systematic drift.

KS test✓ Pass
Wasserstein distance✓ Pass
Anderson-Darling✓ Pass
Chi-square✓ Pass
Energy distance✓ Pass

BH-FDR correction: no rejections. Stochastic variance stays within distributional bounds set by the baseline.

Miscalibrated stochastic generator — statistical test results
Divergent

Stochastic — miscalibrated

Passes all safety-compliance metrics, but fails all 5 statistical tests. The fidelity gap is invisible to rule-based checks alone.

Generator parameters are deliberately miscalibrated — shifted means and inflated variance across all traffic dimensions. Safety behaviours intact, fidelity broken.

KS test✗ Fail
Wasserstein distance✗ Fail
Anderson-Darling✗ Fail
Chi-square✗ Fail
Energy distance✗ Fail

BH-FDR correction: all null hypotheses rejected. Divergent across speed_mps, gap_s, lane_changes, and turn_choice simultaneously.

Key finding: The miscalibrated generator passes every safety metric — stop compliance, red-light rate, collision proxy, and route completion — yet fails all 5 statistical fidelity tests across every traffic dimension. Safety metrics are necessary but not sufficient. Statistical equivalence testing catches what rules miss.
About these charts — Each image shows a 3×3 grid of distribution comparison plots: rows are the 3 generators, columns are speed_mps, gap_s, and lane_changes / turn_choice. Each subplot overlays the generator's sampled distribution (blue) against the ground-truth baseline (orange), with test statistics and BH-adjusted p-values annotated inline. A red border flags a rejected null hypothesis; green confirms equivalence. Generated with Matplotlib + Seaborn via eval/viz.py.

Built with

Python 3.11+  ·  Pandas  ·  PyArrow  ·  NumPy  ·  SciPy  ·  NetworkX  ·  Matplotlib  ·  Seaborn  ·  Click  ·  Pytest